The practice of using metalworking fluids to lubricate and cool the tool/workpiece interface is almost as old as machining itself. Yet, in all this time, no method has been developed for quantifying and comparing the performance of one fluid to another.
All metalworking fluid manufacturers claim that their product is the best, but how can users judge fluid performance? Larger shops typically have fluid engineers on staff. Some use in-house requirements to differentiate products. However, these approaches are not standardized and usually are not shared among shops. Smaller shops have neither the time nor the resources to test metalworking fluids and must rely on the recommendations of fluid suppliers.
Researchers at the Institute of Advanced Manufacturing Sciences have taken steps to change this. We recently completed a three-year study funded by the Environmental Protection Agency, part of which required the development of a method for quantifying the performance of metalworking fluids.
We developed a testing method that any shop can use. The method is flexible enough to cover specific needs, but stringent enough to be considered both scientifically and statistically valid.
The testing procedure is recommended for applications in which abrasive tool wear tends to be uniform. However, it can also be used when wear develops as a result of the tool edge fracturing, chipping or suffering plastic deformation.
With input from both fluid manufacturers and users, we developed methods to compare fluid performance in milling, drilling, turning and grinding. Here, we’ll limit our discussion to evaluating fluid performance in milling.
Test Parameters
Cutting force served as the prime criterion for evaluating fluids. Force gives a quick indication of a fluid’s performance: The lower the force value, the better the fluid.
With each fluid tested, we made repeated cuts on a standard steel part at a designated speed and feed rate. A dynamometer measured force while the tool was in the cut. We repeated this process until the wear on the tool reached a predetermined end-of-life limit. Then we plotted the resultant forces against the number of passes it took to reach the end of the tool’s life.
We first conducted the test on a baseline fluid that we developed and plotted the results. Then we performed the test on a number of subject fluids and compared their performances with that of the baseline fluid.
For the tests, we machined 4140 steel normalized and hardened to RC 24 to 26. The workpiece was 12" long, 4" wide and 1/2" thick. We machined each test piece with an indexable-insert endmill that could be fitted with two inserts. For each test, we used one insert. It was rectangular in shape and uncoated. The cutter body had a 1"-dia. straight shank.
Because inserts can vary in size, we measured each insert to maintain consistency. We used uncoated inserts because they wear faster than coated inserts, which shortened the test times.
Cutting parameters were held constant for every test. We ran the tests at a speed of 400 sfm, a feed rate of 0.005 ipt, a 0.500" axial depth of cut, a 0.060" radial DOC and a 4.000" length of cut per pass.
Our first test was on the baseline fluid, which consisted of water and a rust inhibitor (triethanolamine) mixed in a 1 percent solution. We chose this formulation because it is reproducible and its elements are consistent and easy to acquire and mix. It also contains no lubricant, making all other fluids “better” by default.
All aspects of the test on the baseline fluid were identical to the tests on all of the subject fluids, and the results were recorded in the same way. The only variable was the fluid itself.
End-of-Life Criteria
Under typical shop conditions, the end of a tool’s life is the point at which it stops making acceptable parts. Because running these tests costs money in terms of facility time and machine time, we established the following end-of-life criteria:
Uniform flank wear of 0.015" averaged over the length of contact between the insert and the workpiece; or
Maximum flank wear of 0.030" localized at any point within the length of contact between the insert and the workpiece.
Since 10 people could measure the same insert’s wear and determine 10 different values, only one person made the measurements for each test. This person used a toolmaker’s microscope to view the insert at 305 or greater magnification. A mounting device was incorporated into the stage of the microscope to ensure consistent positioning of the insert.
Our machine setup consisted of a vise bolted to a dynamometer, which, in turn, was bolted to the machine table. The dynamometer was affixed to filtering and recording devices, which connected to a PC that captured the data. We used a vertical milling machine with enough spindle power to make the cuts. For consistency, it is important to use the same machine for every test.
With the workpiece positioned in the vise so that the 4"-wide end was accessible, we milled across its width while recording the data. We made repeated passes, recording the force each time, until we reached one of the end-of-life criteria. At regular intervals, we removed the insert and measured the wear. We repeated the tests a statistically significant number of times for both the baseline and subject fluids.
Once we collected the cutting-force data and established the number of passes needed to reach the end of the tool’s life, we developed and plotted the results. For all data sets for the subject fluid, we used a commercially available data-reduction software package to reduce the forces along the Cartesian axes to a resultant force. Then we calculated an average of those resultant forces, as shown in Table 1, and plotted that average against the number of passes for each force data point.
Pass #1 Pass #5 Pass #10 Pass #15 Pass #20 Pass #25 Pass #30 Pass #35 Pass #40 Pass #45 Pass #50 Pass #55 Pass #60 Pass #65 Pass #70 Pass #75
Test #1 16.9 24.9 32.5 41.2 51.2 55.2 61.0 68.0 70.5 79.4 87.5 89.4 92.2 94.1 94.1 96.1
Test #2 17.1 25.4 32.8 40.9 49.9 57.0 60.7 67.9 71.2 80.1 88.0 97.8 94.5 93.2 94.2 95.7
Test #3 17.1 25.8 33.1 41.5 49.9 56.9 60.5 68.2 69.8 77.9 86.2 88.4 91.9 94.0 96.9 94.9
Test #4 18.0 25.4 33.2 42.0 50.2 55.8 61.2 68.4 70.4 78.4 84.7 89.4 92.0 93.8 94.4 95.8
Test #5 17.9 25.4 32.9 41.6 51.0 56.2 60.5 68.1 71.0 79.1 84.9 88.7 93.0 92.0 94.9 95.4
Average 17.4 25.4 32.9 41.4 50.4 56.2 60.8 68.1 70.6 79.0 86.3 90.7 92.7 93.4 94.9 95.6
Table 1: Resultant forces for the subject fluid
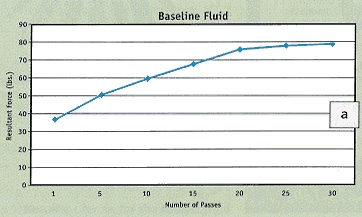
The statistics developed from the data contained the maximum, minimum and mean resultant forces. The plots shown in Figure 1 depict these forces. Figure 1a shows the mean value of the resultant force when using the baseline fluid. We averaged and plotted the results of innumerable runs and found that tools used with the baseline fluid consistently met one of the end-of-life criteria at 30 passes.
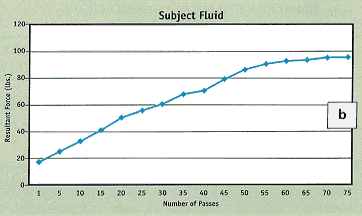
Figure 1b shows the mean value of the resultant force on the tools during testing of the subject fluid. On average, these tools met one of the criteria at 75 passes.
|
|
Baseline Comparison
The goal of these tests was to establish a comparison between the baseline fluid and the subject fluid. From that comparison, we could rank the performance of any number of subject fluids.
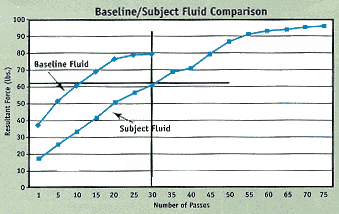
To compare the baseline fluid to the subject fluid, a single plot of the two fluids with comparative axes is required (Figure 2). It is valid to plot both fluids on the same graph because the machining parameters were held constant. To generate a force value for comparing the two fluids, we added reference lines to the chart. We drew a vertical line from the baseline fluid at 30 passes through the subject-fluid plot line. From that intersection, we drew a horizontal line to the Y-axis (resultant force). This force value, measured in pounds, is the number used to compare the subject fluid to the baseline fluid.

Figure 2: Comparison of force values for the two fluids.
Note the relative position of the plot of the baseline fluid. We formulated the baseline fluid so that it would perform significantly worse than any subject fluid. The baseline fluid has no lubrication additive to help reduce cutting forces, so it will always plot out to the left of the subject fluid. From the reference lines that were added to Figure 2, we determined that the subject fluid, compared to the baseline fluid, had a force value of 61.
If another fluid were tested and had a force value lower than 61, it would be considered superior to the subject fluid described here. We would expect the superior fluid to extend tool life or allow higher material-removal rates.
An advantage to this testing method is that the performance of a metalworking fluid is compared to a baseline fluid, not to another metalworking fluid. This permits a force value to be determined for the subject fluid without running the tool to the end of its life. This saves a significant amount of time and effort.
Fluid Clearinghouse
The procedure described here has not been established as a standard for testing metalworking fluids. But it is a formal method for comparing fluids—something that has not existed before.
The Institute of Advanced Manufacturing Sciences hopes to eventually serve as a clearinghouse for fluid data gathered by assorted machine shops. Perhaps when enough data is collected, the industry will have a standard for judging metalworking fluids.
About the Author
Michael Gugger is a tooling and process engineer with the Institute of Advanced Manufacturing Sciences, Cincinnati. The full text of the study discussed in this article can be found in IAMS Pollution Prevention Guide to Using Cutting Fluids in Metal Machining Operations.
Related Glossary Terms
- abrasive
abrasive
Substance used for grinding, honing, lapping, superfinishing and polishing. Examples include garnet, emery, corundum, silicon carbide, cubic boron nitride and diamond in various grit sizes.
- cutting force
cutting force
Engagement of a tool’s cutting edge with a workpiece generates a cutting force. Such a cutting force combines tangential, feed and radial forces, which can be measured by a dynamometer. Of the three cutting force components, tangential force is the greatest. Tangential force generates torque and accounts for more than 95 percent of the machining power. See dynamometer.
- depth of cut
depth of cut
Distance between the bottom of the cut and the uncut surface of the workpiece, measured in a direction at right angles to the machined surface of the workpiece.
- dynamometer
dynamometer
When drilling, a device for measuring the generated torque and axial force (thrust). When milling, a device for measuring the generated torque and feed force. When turning, a device for measuring the tangential, feed and radial forces.
- endmill
endmill
Milling cutter held by its shank that cuts on its periphery and, if so configured, on its free end. Takes a variety of shapes (single- and double-end, roughing, ballnose and cup-end) and sizes (stub, medium, long and extra-long). Also comes with differing numbers of flutes.
- feed
feed
Rate of change of position of the tool as a whole, relative to the workpiece while cutting.
- flank wear
flank wear
Reduction in clearance on the tool’s flank caused by contact with the workpiece. Ultimately causes tool failure.
- gang cutting ( milling)
gang cutting ( milling)
Machining with several cutters mounted on a single arbor, generally for simultaneous cutting.
- grinding
grinding
Machining operation in which material is removed from the workpiece by a powered abrasive wheel, stone, belt, paste, sheet, compound, slurry, etc. Takes various forms: surface grinding (creates flat and/or squared surfaces); cylindrical grinding (for external cylindrical and tapered shapes, fillets, undercuts, etc.); centerless grinding; chamfering; thread and form grinding; tool and cutter grinding; offhand grinding; lapping and polishing (grinding with extremely fine grits to create ultrasmooth surfaces); honing; and disc grinding.
- inches per tooth ( ipt)
inches per tooth ( ipt)
Linear distance traveled by the cutter during the engagement of one tooth. Although the milling cutter is a multi-edge tool, it is the capacity of each individual cutting edge that sets the limit of the tool, defined as: ipt = ipm/number of effective teeth 5 rpm or ipt = ipr/number of effective teeth. Sometimes referred to as the chip load.
- metalworking
metalworking
Any manufacturing process in which metal is processed or machined such that the workpiece is given a new shape. Broadly defined, the term includes processes such as design and layout, heat-treating, material handling and inspection.
- milling
milling
Machining operation in which metal or other material is removed by applying power to a rotating cutter. In vertical milling, the cutting tool is mounted vertically on the spindle. In horizontal milling, the cutting tool is mounted horizontally, either directly on the spindle or on an arbor. Horizontal milling is further broken down into conventional milling, where the cutter rotates opposite the direction of feed, or “up” into the workpiece; and climb milling, where the cutter rotates in the direction of feed, or “down” into the workpiece. Milling operations include plane or surface milling, endmilling, facemilling, angle milling, form milling and profiling.
- milling machine ( mill)
milling machine ( mill)
Runs endmills and arbor-mounted milling cutters. Features include a head with a spindle that drives the cutters; a column, knee and table that provide motion in the three Cartesian axes; and a base that supports the components and houses the cutting-fluid pump and reservoir. The work is mounted on the table and fed into the rotating cutter or endmill to accomplish the milling steps; vertical milling machines also feed endmills into the work by means of a spindle-mounted quill. Models range from small manual machines to big bed-type and duplex mills. All take one of three basic forms: vertical, horizontal or convertible horizontal/vertical. Vertical machines may be knee-type (the table is mounted on a knee that can be elevated) or bed-type (the table is securely supported and only moves horizontally). In general, horizontal machines are bigger and more powerful, while vertical machines are lighter but more versatile and easier to set up and operate.
- plastic deformation
plastic deformation
Permanent (inelastic) distortion of metals under applied stresses that strain the material beyond its elastic limit.
- shank
shank
Main body of a tool; the portion of a drill or similar end-held tool that fits into a collet, chuck or similar mounting device.
- turning
turning
Workpiece is held in a chuck, mounted on a face plate or secured between centers and rotated while a cutting tool, normally a single-point tool, is fed into it along its periphery or across its end or face. Takes the form of straight turning (cutting along the periphery of the workpiece); taper turning (creating a taper); step turning (turning different-size diameters on the same work); chamfering (beveling an edge or shoulder); facing (cutting on an end); turning threads (usually external but can be internal); roughing (high-volume metal removal); and finishing (final light cuts). Performed on lathes, turning centers, chucking machines, automatic screw machines and similar machines.


